All-sky astronomy with HiPS and MOCs was Tutorial 1 presented during ADASS XXVIII, Sunday, November 11 2018, 13:00-15:00
This page
Instructor: Sébastien Derriere (CDS).
Introduction
The main goal of this tutorial is to teach participants how to use recent Virtual Observatory standards allowing exploration and querying of all-sky datasets. The Hierarchical Progressive Survey (HiPS) and the Multi-Order Coverage map (MOC) can be used by data providers to expose their datasets (images or catalogues), and astronomers can use them to perform complex queries on all-sky datasets. Participants will create image and catalogue HiPS, learn how to compare them to reference datasets, and share them in a web page. Advanced usage with the Table Access Protocol and astropy/MOCpy will also be shown.
Primary learning objectives
- How to generate HiPS and MOCs from example datasets, for both image and catalogue data.
- How to visualize all-sky datasets from the full-sky view, down to the original full resolution, and how to share and publish them (for example with Aladin lite).
- How to compare, combine and query large datasets, using CDS tools like Aladin desktop or scripts in Python.
Requirements for participants
- Personal laptop with at least 1GB of available disk space for data storage and processing, Wifi or network access.
- Software - you can run the tutorial with Windows, Linux or MAC, provided you have installed:
- Web browser with JavaScript enabled.
- Java 7 or higher, and ability to run command-line programs.
- Aladin Desktop
- HipsGen-Cat
- Optionally: Python with Astroquery (astropy) package and MOCpy (for advanced use case 6.2).
Please download these data samples before attending the tutorial !
Test images and catalogues (~200MB total – will be available on USB sticks during the tutorial if needed):
Plan
- Introduction slideshow (10'). Presenting the goals of the tutorial, what HiPS and MOCs are, the tools that will be used, and the tutorial structure.
- 1. Generate HiPS image survey and MOC from a collection of individual images (15')
- 2. Catalogue HiPS (15'). Generate HiPS from catalogue for progressive access.
- 3. Comparing with other surveys (10'). Visualization of the two HiPS in Aladin desktop, comparison with other existing surveys. Use of very large datasets like Pan-STARRS, HST images or Gaia DR2 to demonstrate the scalability.
- 4. Queries by MOC (15'). Use Aladin desktop to compute the intersection of several MOCs. Use the result to query other VizieR catalogues.
- 5. Publishing with Aladin Lite (15'). Embedding in a webpage with Aladin lite.
- 6. Adanced usage of HiPS and MOCs
- 6.1 Healpix in TAP/ADQL queries (20'). Visualize the rotation of the LMC in Gaia DR2 data.
- 6.2 Programmatic use in Python (20'). astroquery.cds and MOCPy.
- Final questions ?
1. Generate HiPS image survey and MOC
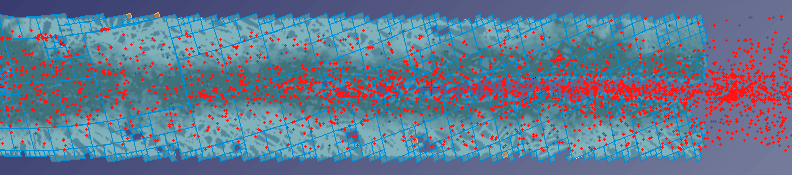
You can use Aladin Desktop to generate a HiPS image survey from a collection of calibrated FITS images. As an example, we will use a small sample of images from the ISOPHOT 170 micron Serendipity Survey (Stickel et al. 2007), covering a fraction of the galactic plane.
If you have not downloaded the data sample yet, ask a tutor to retrieve it from a USB stick.
Make sure the 6 sample FITS images are located in a single folder, named /data/ISOPHOT for example.
/data/ISOPHOT$ ls
PSSA030+00.fits  PSSA050+00.fits  PSSA070+00.fits  PSSA090+00.fits  PSSA110+00.fits  PSSA130+00.fits
1.1 HiPS image
Launch Aladin desktop, by running the appropriate launcher, or executing:
java -Xmx2048m -Xms1024m -jar Aladin.jar
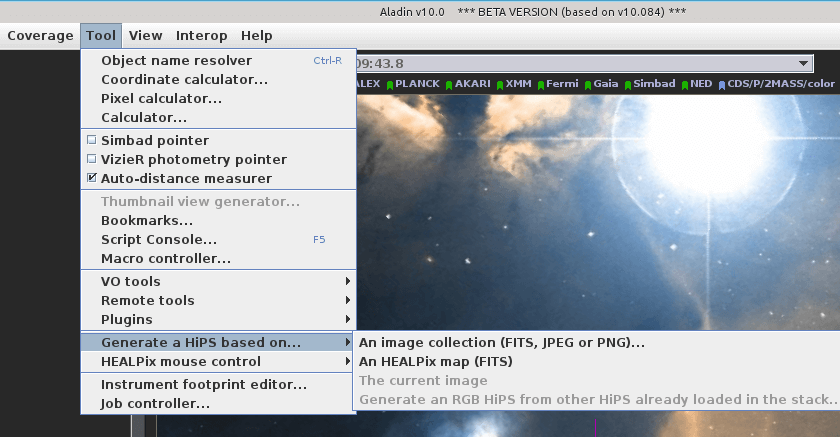
In Aladin Desktop, go to :
Tool > Generate a HiPS based on... > An image collection (FITS, JPEG or PNG)...
You need to indicate the name of the directory containing the Source files, and the Target directory where the hierarchy of files of the HiPS will be stored. You can provide a name for the dataset.
Click on See one original image..., and notice that blank pixels have value 0,
so we use this value in the form for the option Alternate blank FITS value.
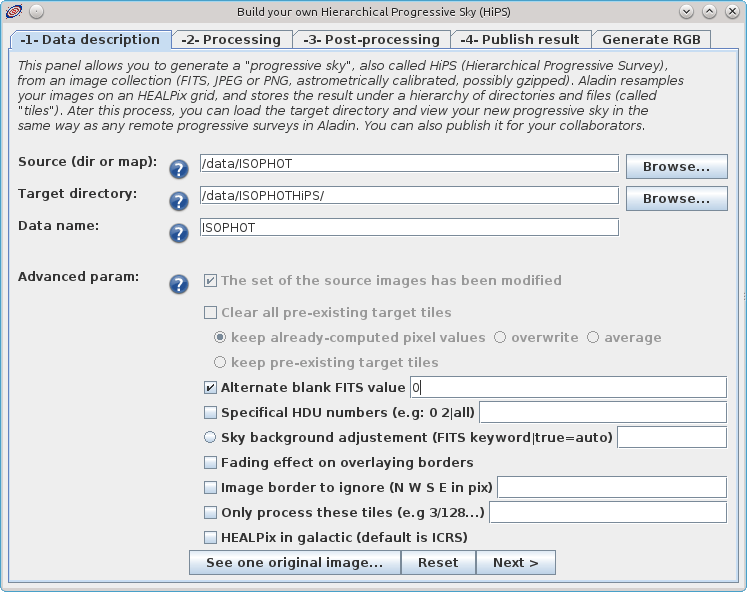
Click Next >, and start the processing with the default parameters.
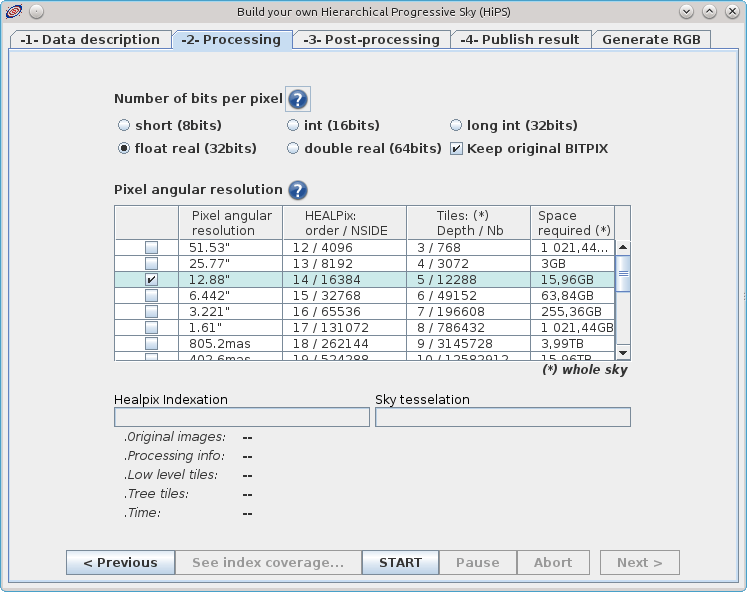
Click START. This will generate the FITS tiles of an image HiPS.
Tip: if the contrast or the dynamic range of pixel values is wrong, you can adjust
it by zooming in on a region with valid pixels, clicking on the pixel button
![]() , and clicking on
, and clicking on Local cut.
Once finished, we will generate PNG versions of the tiles by pressing Build in the following panel:
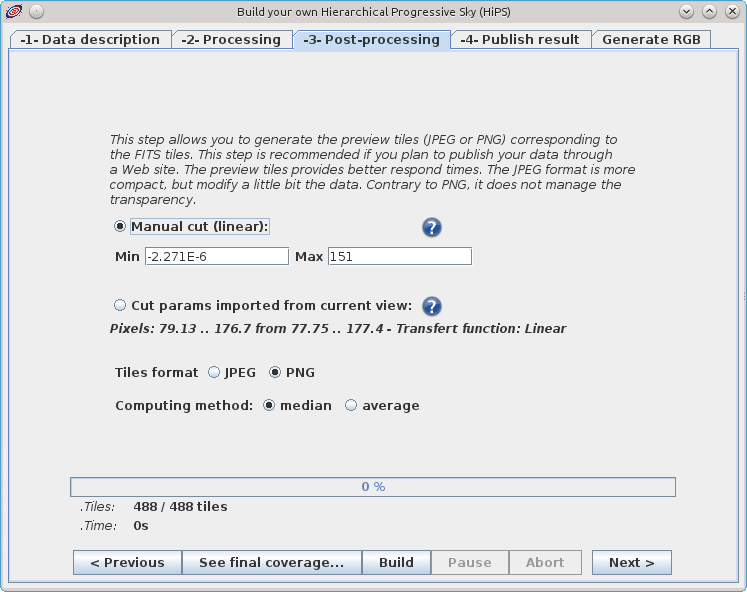
The cuts will control the contrast of the PNG tiles. A Min cut close to zero, and a Max cut between 150 and 600 should give acceptable results.
We will ignore the next two sections (4- Publish result, and Generate RGB) in this tutorial. More details on generating image HiPS, fine-tuning the process, providing relevant metadata, and ultimately distributing the result can be found on the page Generate your HiPS in 10 steps.
You can now visualize your image HiPS in Aladin Desktop. Try to zoom in/out, pan around, and compare this HiPS to one of the original individual FITS image.
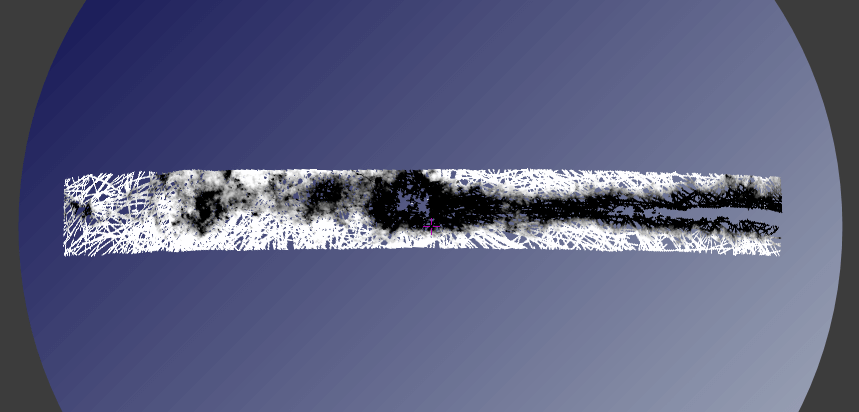
1.2 MOC for an image survey
A MOC file has been automatically generated: try to visualize it by loading it as a
local file (Ctrl+O) in the ISOPHOTHiPS directory: MOC.fits.
The default MOC has been computed at order 10. Overlay the Healpix grid to check
this: (Overlay > HEALPix grid or Alt+W), and zoom in.
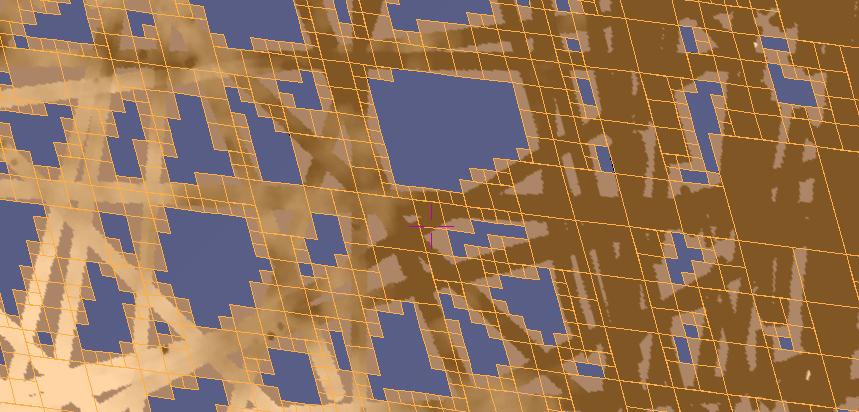
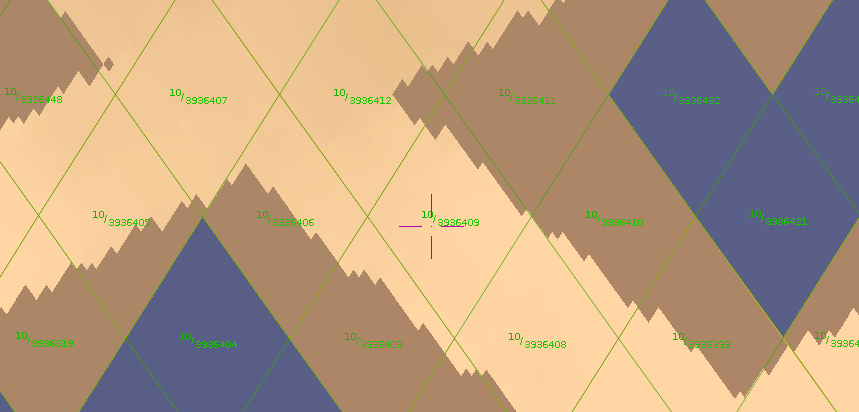
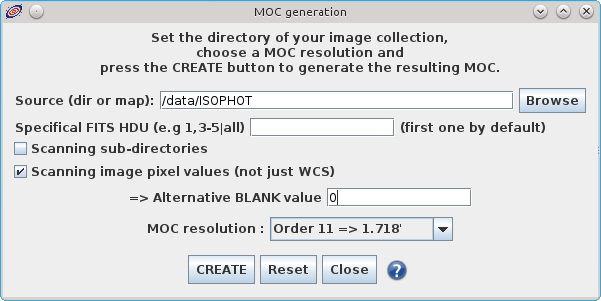
We can create a more detailed MOC, for example at level 11.
Coverage > Generate a MOC based on... > An image collection.
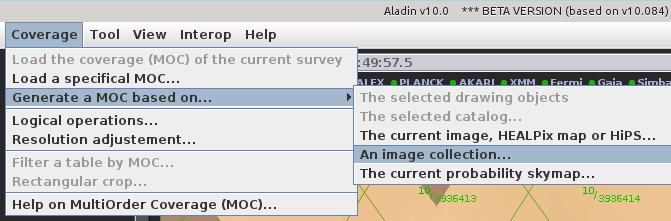
Indicate the directory containing the original images. Check Scanning image pixel values,
Alternative BLANK value=0, and choose MOC resolution Order 11.
Overlay the two MOCs and compare the resolution and properties (e.g. sky coverage) by hovering your mouse over the plane in the stack.
2. Catalogue HiPS
You can create a progressive version of a catalogue with the Hipsgen-cat tool.
Detailed instructions are available here.
We will work with the MSX6C Infrared point source catalogue
(Egan et al., 2003),
V/114 in VizieR. The
msx6_gp
table contains 431711 rows, and has been extracted in VOTable base64 format in the file:
vizier_votable.b64 in the data samples.
Generate the catalogue HiPS by running the following command:
java -jar Hipsgen-cat.jar -cat MSX6C -in vizier_votable.b64 -f VOT -ra _RAJ2000 -dec _DEJ2000 -lM 6 -score B2 -desc -out /path_to/MSX6C
This could take a couple of minutes: you might want to start
section 3 while this is completing. The command will create
a progressive version of the catalogue, with a maximum HEALPix order 6 (-lM 6),
where the sources with the highest values of B2 are shown first, and lower values only
when one zooms in locally.
Overlay this progressive catalogue by opening the top directory
/path_to/MSX6C as a local file in Aladin desktop (Ctrl+O).
3. Comparing with other surveys
HiPS can be computed for many different surveys, with a wide range of spatial coverages and spatial resolutions, and allows comparison and exploration of terabyte-sized datasets. The data collections tree in Aladin desktop provides access to over 300 image HiPS. Try to load the progressive versions of some reference image surveys:
- Optical > PanSTARRS > DR1 color
- Optical > HST > HST-V
- Infrared > HERSCHEL > Herschel SPIRE color
You can compare these various surveys by changing the opacity of the overlaid
images (click on the plane name, and use the opac. Slider), or you can use
the multi-view and match buttons below the main panel
 to compare the view
and align them.
to compare the view
and align them.
Type Gaia in the select field below the collections data tree: this will filter sources related to Gaia, and choose the progressive access to the Gaia DR2 catalogue.
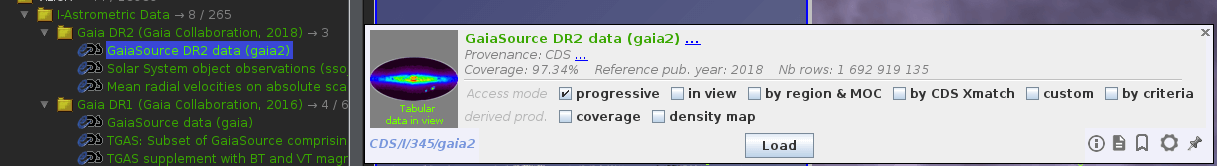
Try to zoom in until all Gaia DR2 sources in the field of view are displayed (the progress bar turns full green).
HiPS can be created for different data products, such as density maps of flux maps.
Try to load a Gaia DR2 color flux map computed from flux values in the catalogue:
Collections > Ancillary > Gaia DR2 > Color flux map
HiPS can also be applied to make progressive data cubes !
4. Queries by MOC
One can perform logical operations on MOCs (such as union, intersection), or use MOCs to perform complex spatial queries. Load in Aladin desktop:
- The ISOPHOT MOC we computed earlier at order 11 (should still be in your stack)
- The HST V band MOC (
Collections > Image > Optical > HST > HLA > HST-V > coverage)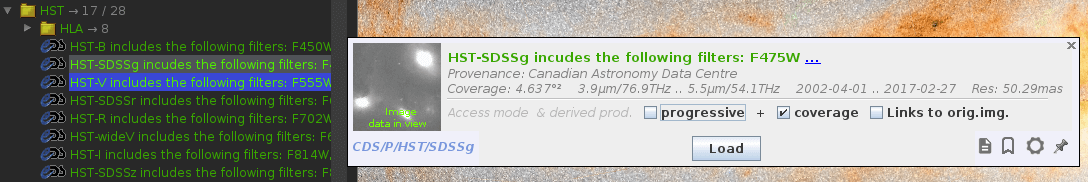
- The GALEX MOC (
Collections > Image > UV > GALEX > GALEX GR6 AIS color > coverage)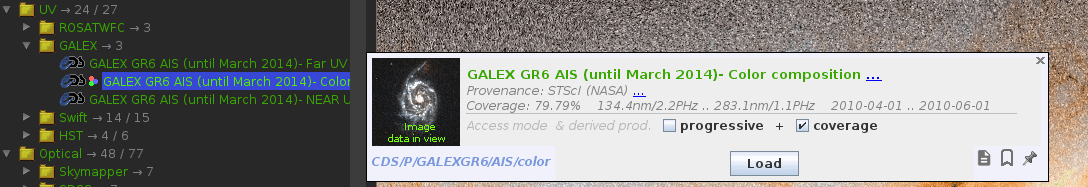
And compute the intersection of the 3 MOCs: Coverage > Logical operations
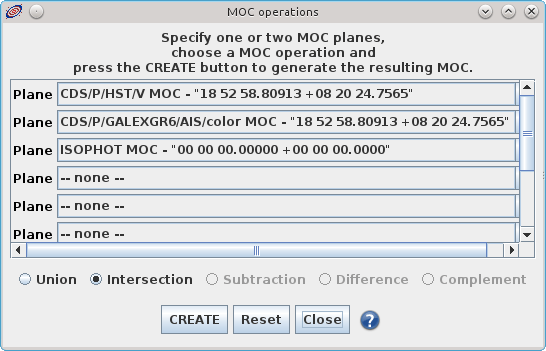
This will compute a new MOC describing the sky coverage covered by ISOPHOT,
HST-V and GALEX. This MOC can be used to query catalogues, even very large ones.
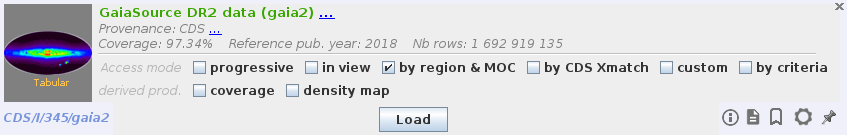
Make sure (in the properties) that the area is small, select the MOC
plane, select the Gaia DR2 catalogue in the collections tree, and query it
by region & MOC. You should get a few thousand sources (4263) out of
the 1.7 billion.
5. Publishing with Aladin Lite
With Aladin Lite, you can easily embed HiPS in any web page. All you need is the directory structure of the HiPS to be accessible on a web server. You can generate example code to be integrated in an HTML web page on this page.
Check the Aladin Lite API https://aladin.cds.unistra.fr/AladinLite/doc/API/, which explains how to integrate custom image and catalogue HiPS in Aladin Lite.
We will try to create a simple HTML web page to embed the ISOPHOT HiPS and the progressive MSX6C catalogue you created earlier. Depending on your level of expertise in running http servers, you can choose to do it using the easy method, or the (hopefully not so) hard one:
Easy method
A copy of the HiPS data have already been installed on a web server, with the following base URLs:
- HiPS image : https://cds.unistra.fr/adass2018/ISOPHOTHiPS/
- HiPS catalogue : https://cds.unistra.fr/adass2018/MSX6C/
Save the following piece of code
as an HTML file on your computer, for example /path/to/test.html
<html>
<head>
    <meta name="description" content="Test page for ADASS 2018 Tutorial 1" />
</head>
<body>

    <!-- insert this snippet where you want Aladin Lite viewer to appear and after the loading of jQuery -->
    <div id="aladin-lite-div" style="width:700px;height:400px;"></div>
    <script type="text/javascript" src="https://aladin.cds.unistra.fr/AladinLite/api/v3/latest/aladin.js" charset="utf-8"></script>
    <script type="text/javascript">
    let aladin;
    A.init.then(() => {
        aladin = A.aladin('#aladin-lite-div', {survey: "P/DSS2/color", fov:60}, target: "Cepheus A"});
        aladin.setImageSurvey(aladin.createImageSurvey("ISOPHOT", "ISOPHOT / ADASS tutorial", "https://cds.unistra.fr/adass2018/ISOPHOTHiPS/", "equatorial", 10, {imgFormat: 'png'})); // setting a custom HiPS
        aladin.addCatalog(A.catalogHiPS("https://cds.unistra.fr/adass2018/MSX6C/", useProxy=false))
    });
    </script>
</body>
</html>
As you can see, the javascript code uses these URLs to load the data into
Aladin Lite. You can test your HTML file by opening it in a browser, with
a local URL: file:///path/to/test.html (there are 3 / after file:).
Hard(?) method
Accessing the data locally on your computer requires to run a local http server. You can start a simple http server on your local machine with Python 3, running the following command in the directory you want to serve on http:
~/path/to/tutorial$ python3 -m http.server
Serving HTTP on 0.0.0.0 port 8000 (http://0.0.0.0:8000/) ...
This will return the URL (here http://0.0.0.0:8000/) where the contents of
the directory ~/path/to/tutorial is made accessible.
Adapt the piece of code given in the Easy method to access the local
resources, for example: http://0.0.0.0:8000/ISOPHOTHiPS/. Save the HTML
file, e.g. test.html in the directory where you started the http server,
and open it in a browser, e.g. http://0.0.0.0:8000/test.html .
You should get a result similar to the following:
For more details on sharing your custom HiPS with the community, see: Generate your HiPS in 10 steps.
6. Adanced usage of HiPS and MOCs
6.1 Healpix in TAP/ADQL queries
We will try to run a TAP query to the Gaia DR2 catalogue to visualize the rotation pattern of the Large Magellanic Cloud. You can do TAP queries (written in ADQL) on Gaia DR2 data in different ways:
- On the TAP VizieR web interface.
- From TOPCAT.
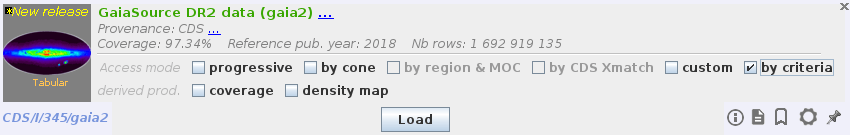
- From Aladin Desktop (
by criteria).
6.1.1 Find the average proper motions in the LMC area
Go to the TAP VizieR web interface
for Gaia DR2, or search
Gaia in the main TAP VizieR interface.
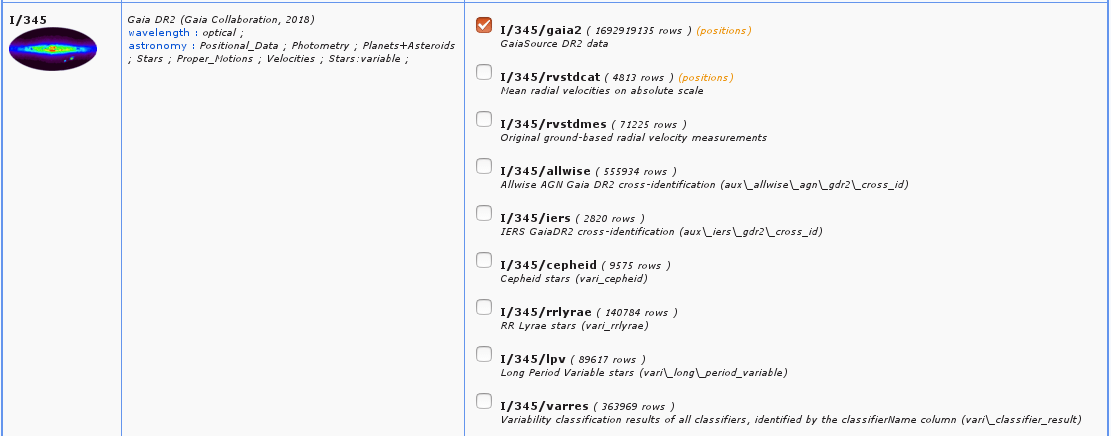
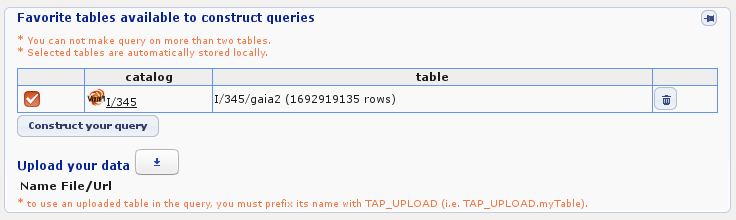
Select I/345/gaia2 and click on Construct your query at the top right.
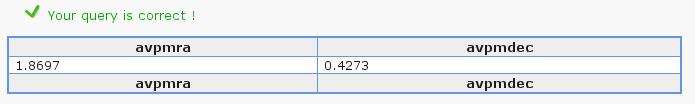
Enter the following ADQL query to retrieve the average proper motions within 1° of LMC.
Average proper motion
ivo://ivoa.net/std/TAP/v1.0
I/345/gaia2SELECT avg(pmra) as avpmra, avg(pmdec) as avpmdec
FROM "I/345/gaia2"
WHERE CONTAINS(POINT('ICRS',ra,dec),CIRCLE('ICRS',80.8942,-69.7561,1.))=1
AND sqrt(pmra*pmra+pmdec*pmdec)<30
SELECT avg(pmra) as avpmra, avg(pmdec) as avpmdec
FROM "I/345/gaia2"
WHERE CONTAINS(POINT('ICRS',ra,dec),CIRCLE('ICRS',80.8942,-69.7561,1.))=1
AND sqrt(pmra*pmra+pmdec*pmdec)<30
Try it !
 Querying : vizier
You can run the query. Or just click "Preview" for this simple case:
6.1.2 Proper motions in different regions of the LMC
We will try to do a map of proper motions values in the LMC, averaging values on different Healpix cells. In Aladin, locate the Gaia DR2 catalogue, and query by criteria:
This will open a window where you can type a TAP query:
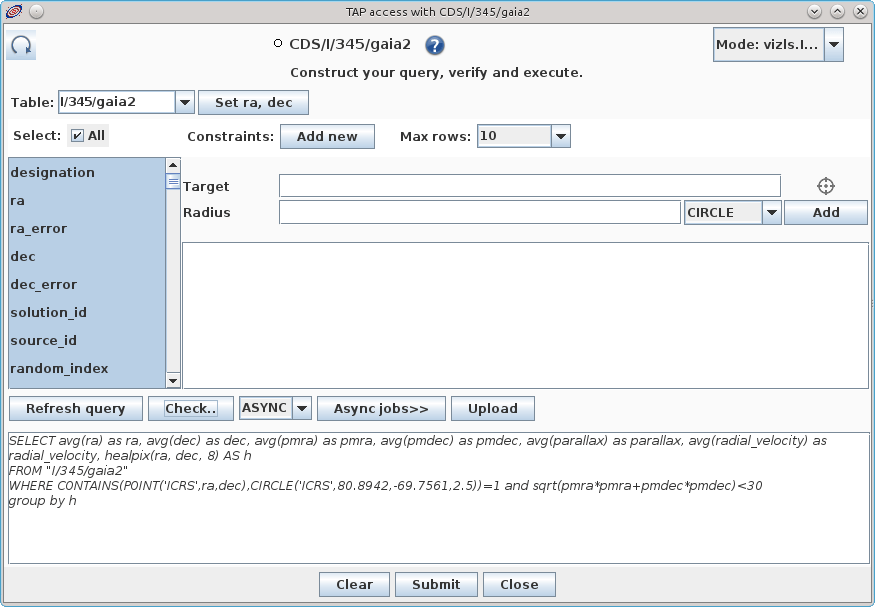
Make sure to choose the ASYNC mode, and type and run the following query
Average proper motion
ivo://ivoa.net/std/TAP/v1.0
I/345/gaia2SELECT avg(ra) as ra, avg(dec) as dec, avg(pmra) as pmra, avg(pmdec) as pmdec,
avg(parallax) as parallax, avg(radial_velocity) as radial_velocity, healpix(ra, dec, 8) AS h
FROM "I/345/gaia2"
WHERE CONTAINS(POINT('ICRS',ra,dec),CIRCLE('ICRS',80.8942,-69.7561,2.5))=1
AND sqrt(pmra*pmra+pmdec*pmdec)<30
GROUP BY h
SELECT avg(ra) as ra, avg(dec) as dec, avg(pmra) as pmra, avg(pmdec) as pmdec,
   avg(parallax) as parallax, avg(radial_velocity) as radial_velocity, healpix(ra, dec, 8) AS h
FROM "I/345/gaia2"
WHERE CONTAINS(POINT('ICRS',ra,dec),CIRCLE('ICRS',80.8942,-69.7561,2.5))=1
   AND sqrt(pmra*pmra+pmdec*pmdec)<30
GROUP BY h
Try it !
Querying : vizier
This may take a few minutes to execute. While the query is being processed, you can prepare the last step below. It the query fails to complete, you can download a copy of the VOTable output here
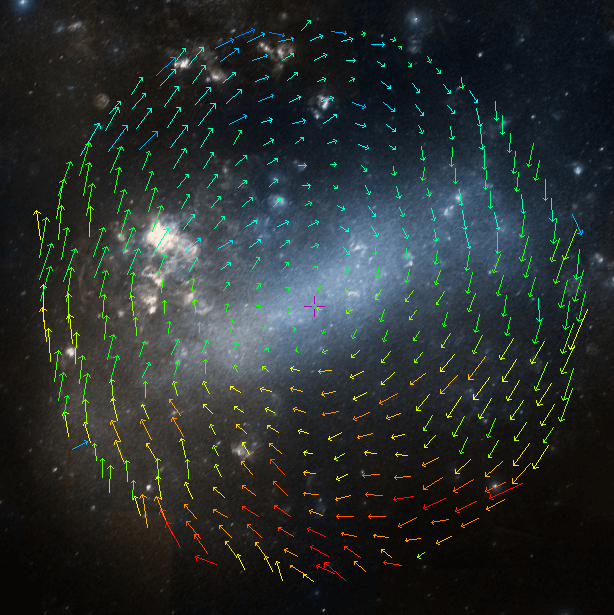
6.1.3 Visualize it in Aladin
Aladin Filters can be used to filter out and/or change the appearance of
sources in catalogue planes.
Create a new Filter in Aladin Catalog > Create a filter. Go to advanced mode,
and use the above values as average pmra and pmdec,
yielding the following syntax:
${pmra}*${pmra}+${pmdec}*${pmdec}<6{
  draw pm(2000*(${pmra}-1.8697), 2000*(${pmdec}-0.4273)) rainbow(${pmra}*${pmra}+${pmdec}*${pmdec}, 2, 5)
}
Once the TAP query is complete, you should see the following result:
6.2 Programmatic use in Python
There is a Python interface to the CDS MOCServer, a server containing MOC and
metadata informations for a large number of datasets.
https://astroquery.readthedocs.io/en/latest/cds/cds.html.
You can query the MOCServer with the query_region() method, and the region
parameter can be a mocpy.MOC object. This allows you to find all datasets
intersecting any MOC.
We will use Python commands to do the following :
- Download custom and official MOCs.
- Compute their intersection.
- Visualize them using
pyplot. - Find a selection of VizieR infrared catalogues containing data in the MOC that we have created in section 4.
- Visualize MOCs with Aladin Lite using
ipyaladin, and overlay catalogues. - Query a catalogue by MOC.
In order to ease the execution for those not familiar with Python, the commands are
presented in a Jupyter notebook.
Each ADASS participant has been attributed a username, in the following form:
completelastname_i, where completelastname is your family name (all lower case,
no spaces, but - have been kept if present) and i is the initial of your first name,
preceded by a _.
Launch the notebook, and press Shift+Return to execute each step.
The online notebook will not be supported after ADASS.
It is archived in the CDS github repository.